

You're probably staring at a mess right now.
Maybe it's a Google Sheet with tabs named “leads final,” “leads final 2,” and “actual final.” Maybe it's HubSpot, Shopify, Stripe, and a notebook full of call notes that never made it into your CRM. You know the numbers should tell you something useful. Instead, they just glare back at you.
I've seen founders make the same mistake over and over. They think they need fancy dashboards before they can analyze sales data. They don't. They need a clean question, a small set of numbers, and the discipline to stop wandering around the spreadsheet like they're lost in a Costco parking lot.
The good news is simple. You can get real answers with Excel, Google Sheets, or the basic reports already sitting inside your CRM.
Your Sales Data Is a Mess And That's Okay
I've worked with enough early-stage founders to know the usual setup.
Your pipeline lives in one place. Payments live somewhere else. Your actual customer conversations live in your inbox, your DMs, and your head. Then somebody says, “You should be more data-driven,” which is about as helpful as telling a tired cook to “make the food taste better.”
That frustration is normal. Nearly half of sales reps, 45%, say they feel overwhelmed by the number of tools in their stack according to these sales statistics. I'm not surprised. More tools don't create clarity. They often create more hiding places for bad data.
Stop trying to admire the whole mess
When founders first try to analyze sales data, they often open every report they can find. Revenue by month. Leads by channel. Open deals. Lost deals. Website traffic. Refunds. Call notes. They treat the data like a junk drawer and hope a useful answer jumps out.
It won't.
Data without a question is trivia. Data with a question is direction.
If your numbers make you feel dumb, the problem usually isn't you. The problem is that nobody gave you a method.
The method I use is boring, and that's why it works. I pick one business question. I pull only the data tied to that question. I clean it just enough to trust it. Then I look for one decision I can make.
That's it.
What messy data usually looks like
Here's the founder version of “messy”:
- Duplicate deals: The same prospect got entered twice because one record came from a form and one came from a manual note.
- Inconsistent names: “Meta ads,” “Facebook Ads,” and “FB” all mean the same thing, but your sheet treats them like different channels.
- Missing dates: You know a lead closed, but nobody logged when.
- Wishful stages: Deals sit in “proposal sent” for weeks because nobody wants to mark them as dead.
This is fixable. You don't need perfection. You need enough order to stop lying to yourself.
Your first win is small
Don't aim for “full visibility.” That phrase gets founders into trouble. Aim for one answer that changes your next move.
For example:
- Which lead source closes best?
- Which offer has the shortest path to cash?
- Where do deals stall?
- Which customer type buys fastest?
Those questions are manageable. They also lead to action. That's what matters.
Start with Good Questions Not Big Data
Most bad analysis starts with a lazy question.
“What are our sales trends?” sounds smart. It isn't. It's too wide. It gives you permission to scroll through charts for two hours and call it work.
A better question is sharper. It has an owner. It points to a decision.

Ask questions your spreadsheet can answer
A spreadsheet is not a therapist. It won't solve vague anxiety. It can answer concrete questions if you feed it clean inputs.
Good questions sound like this:
- Which lead source brings in our best customers
- Which customer segment has the highest win rate
- How long does it take each offer to close
- Which month had the most lost deals, and why
- Do referrals convert better than outbound leads
Bad questions sound like this:
- What's happening with sales
- Why aren't we growing faster
- What should we do next
- What does the data say
Those are boardroom questions. They're too broad for a founder working in Sheets on a Tuesday night.
Practical rule: If your question doesn't lead to a clear decision, rewrite it.
Pick questions tied to money or time
I like to sort questions into two buckets.
The first bucket is money. Which channels, products, or customer types lead to more revenue. The second bucket is time. Where deals slow down, where follow-up dies, and where your team burns energy without getting paid.
That frame keeps you out of vanity metrics. Likes, clicks, and raw lead volume can matter, but they often distract founders from the numbers that affect cash.
Try this shortlist:
- Where do we win
- Where do we lose
- Where do we get stuck
- What should we do more of
- What should we stop doing
A simple founder filter
Before you touch a report, run your question through this filter:
| Check | What to ask |
|---|---|
| Specific | Can I answer this with data I already have? |
| Timely | Does this matter right now? |
| Actionable | Will the answer change what I do this month? |
If the answer to any of those is no, the question needs work.
I'd rather see a founder answer one narrow question well than build a bloated dashboard that nobody uses. When you analyze sales data with a clear question, the spreadsheet stops feeling like homework. It starts acting like a flashlight.
How to Gather and Clean Your Raw Data
Here's where most founders get impatient.
They want the insight before they do the cleanup. That's like trying to cook in a dirty kitchen while half the ingredients are still in the car. You can do it, but you're going to make a mess and trust the wrong signals.
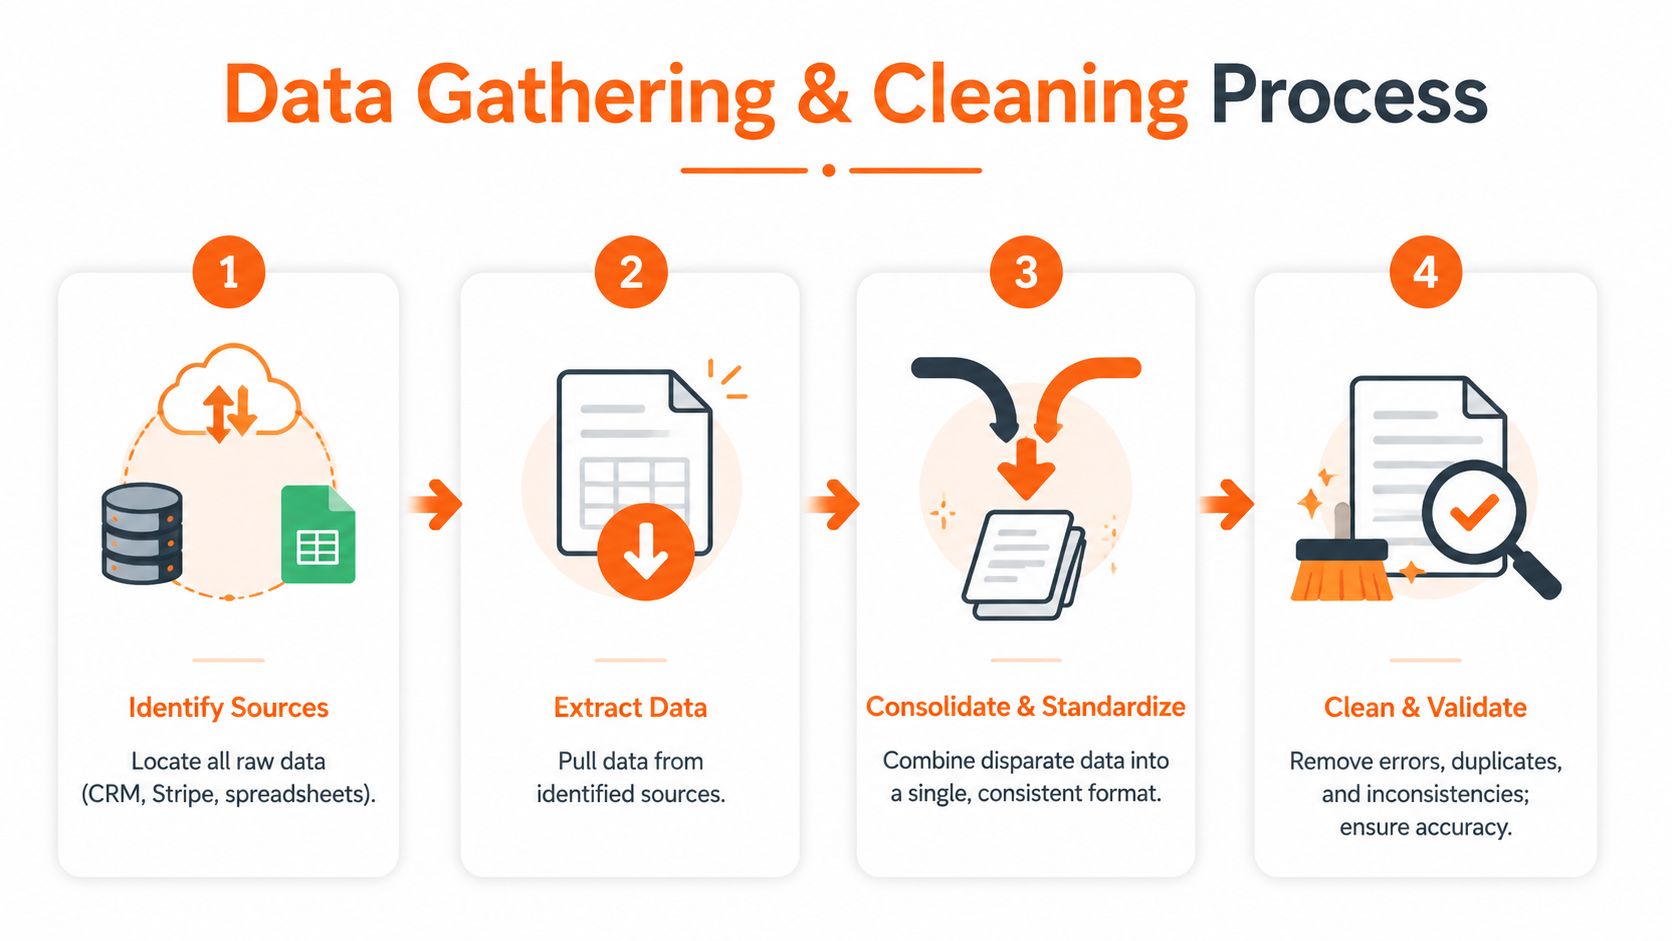
A solid B2B sales data process starts by defining the question, pulling relevant data, and cleaning and standardizing it before comparing anything, as laid out in this sales data guide.
Pull from the places you already use
For most founders, raw sales data sits in a few predictable spots:
- Your CRM: HubSpot, Pipedrive, Salesforce, Close
- Your payment system: Stripe, Shopify, Square
- Your spreadsheet: usually the backup system for everything your main system missed
- Your calendar and inbox: useful for checking dates and follow-up patterns
Start with one master sheet. Put one row per deal or customer. Then create a few core columns.
I'd include:
- Lead source
- Customer name
- Offer or product
- Deal value
- Created date
- Close date
- Current stage
- Won or lost
- Owner
- Customer type or segment
That's enough to do useful work.
Standardize before you analyze
Here's the garage-cleaning part. Ugly, but necessary.
If one row says “Inbound” and another says “in bound,” your sheet sees two channels. If one date is written as text and another as a real date, your formulas break. If one rep logs deal value before discounts and another logs it after discounts, your average deal size gets weird fast.
Clean these first:
- Names: Pick one label for each channel, stage, and segment.
- Dates: Convert everything into a consistent date format.
- Deal values: Use one currency and one rule for discounts.
- Status fields: Decide what counts as won, lost, open, and dead.
If you also track financial performance outside your CRM, a clean structure like this guide to formatting an income statement will help you line up sales activity with actual business results.
Here's a simple example.
| Messy entry | Clean entry |
|---|---|
| FB ads | Meta Ads |
| Meta Ads | |
| referral/word of mouth | Referral |
| Closed Won | Won |
That kind of cleanup feels small. It changes everything.
A quick walkthrough helps if you want to see this process in action.
Validate with common-sense checks
Before I trust a sheet, I ask a few blunt questions:
- Do any won deals have zero revenue
- Do any close dates happen before created dates
- Are there duplicate customer names with different outcomes
- Are old open deals dead
Clean data doesn't need to be fancy. It needs to be believable.
If you skip this part, the rest is theater. Nice charts. Bad decisions.
Uncover Insights with These Key Metrics
Founders get into trouble when they track too much. They end up babysitting dashboards instead of fixing the sales process.
I keep it tight. Strong sales teams focus on 5 to 7 core metrics tied to revenue outcomes, including win rate, average deal size, sales cycle length, pipeline coverage, and forecast accuracy, according to this breakdown of sales data analysis.
That's the right instinct for a small company too.
The founder metrics that actually matter
Here's the cheat sheet I'd use first.
| Metric | What It Tells You | Simple Calculation |
|---|---|---|
| Win rate | How often you close real opportunities | Won deals ÷ total closed deals |
| Average deal size | Whether your offers and buyers are moving up or down market | Total revenue from won deals ÷ number of won deals |
| Sales cycle length | How long cash takes to arrive after a lead enters the pipeline | Close date minus created date, then average it |
| Lead-to-close conversion rate | How efficiently leads become customers | Won customers ÷ total leads |
| Pipeline coverage | Whether you have enough open pipeline relative to your target | Total open pipeline value ÷ revenue target |
| Forecast accuracy | How close your prediction was to actual closed revenue | Compare forecasted revenue to actual revenue |
How to read these numbers like an operator
Win rate is your blunt instrument. If it's weak, you may have a targeting problem, a pricing problem, or a bad pitch. I look at win rate first because it tells me whether I'm talking to the right people in the first place.
Average deal size tells you what kind of business you're really building. If deal size keeps shrinking, your acquisition model might be pulling in low-fit buyers or buyers with weak budgets. If it rises, your messaging may be attracting better customers.
Sales cycle length tells you where momentum dies. Long cycles often mean confusion. Maybe the offer is too complex. Maybe the buyer needs more proof. Maybe your checkout, proposal, or approval process is clunky.
A slow sales cycle is often a trust problem wearing a process costume.
Lead-to-close conversion rate keeps your top-of-funnel hype honest. A lot of founders brag about lead volume while their quality erodes.
Pipeline coverage is basic but useful. It helps you see whether your target is supported by enough open opportunities or whether you're trying to manifest revenue from thin air.
Forecast accuracy matters because bad forecasting creates dumb decisions. You hire too early, cut too late, or overspend on channels that looked better on paper than they did in real life.
Keep your dashboard boring
If you sell on Shopify, Meta, or both, you'll eventually need better visibility across traffic, conversion, and spend. A practical primer on understanding Shopify and Meta data dashboards can help you connect ad data with what turns into revenue.
For margins, I always pair sales metrics with unit economics. If you're closing more deals but making less money on each one, that “growth” can fool you. A quick refresher on gross margin percentage helps keep that straight.
What to do after you spot a pattern
Don't stop at the metric. Ask what operational lever sits behind it.
- Low win rate: tighten targeting or rewrite the offer
- Small deal size: rework packaging, pricing, or upsells
- Long cycle: improve FAQs, proof, demos, or proposal flow
- Weak conversion from lead to close: inspect lead quality and follow-up speed
- Thin pipeline coverage: increase outreach or fix lead generation before panicking about close rates
That's how you analyze sales data like a founder. You don't admire the metric. You use it to decide what to change next.
Build Simple Forecasts You Can Actually Use
Forecasting gets overcomplicated fast.
Founders hear words like regression, predictive models, and time series, then assume forecasting is for analysts in expensive software. That's nonsense. Many guides push complex methods, but few explain how to set up low-cost CRM or cloud tools for the basic forecasting early-stage founders require, as noted in this plain-English take on sales analysis.
You don't need a PhD. You need a decent guess that helps you plan.
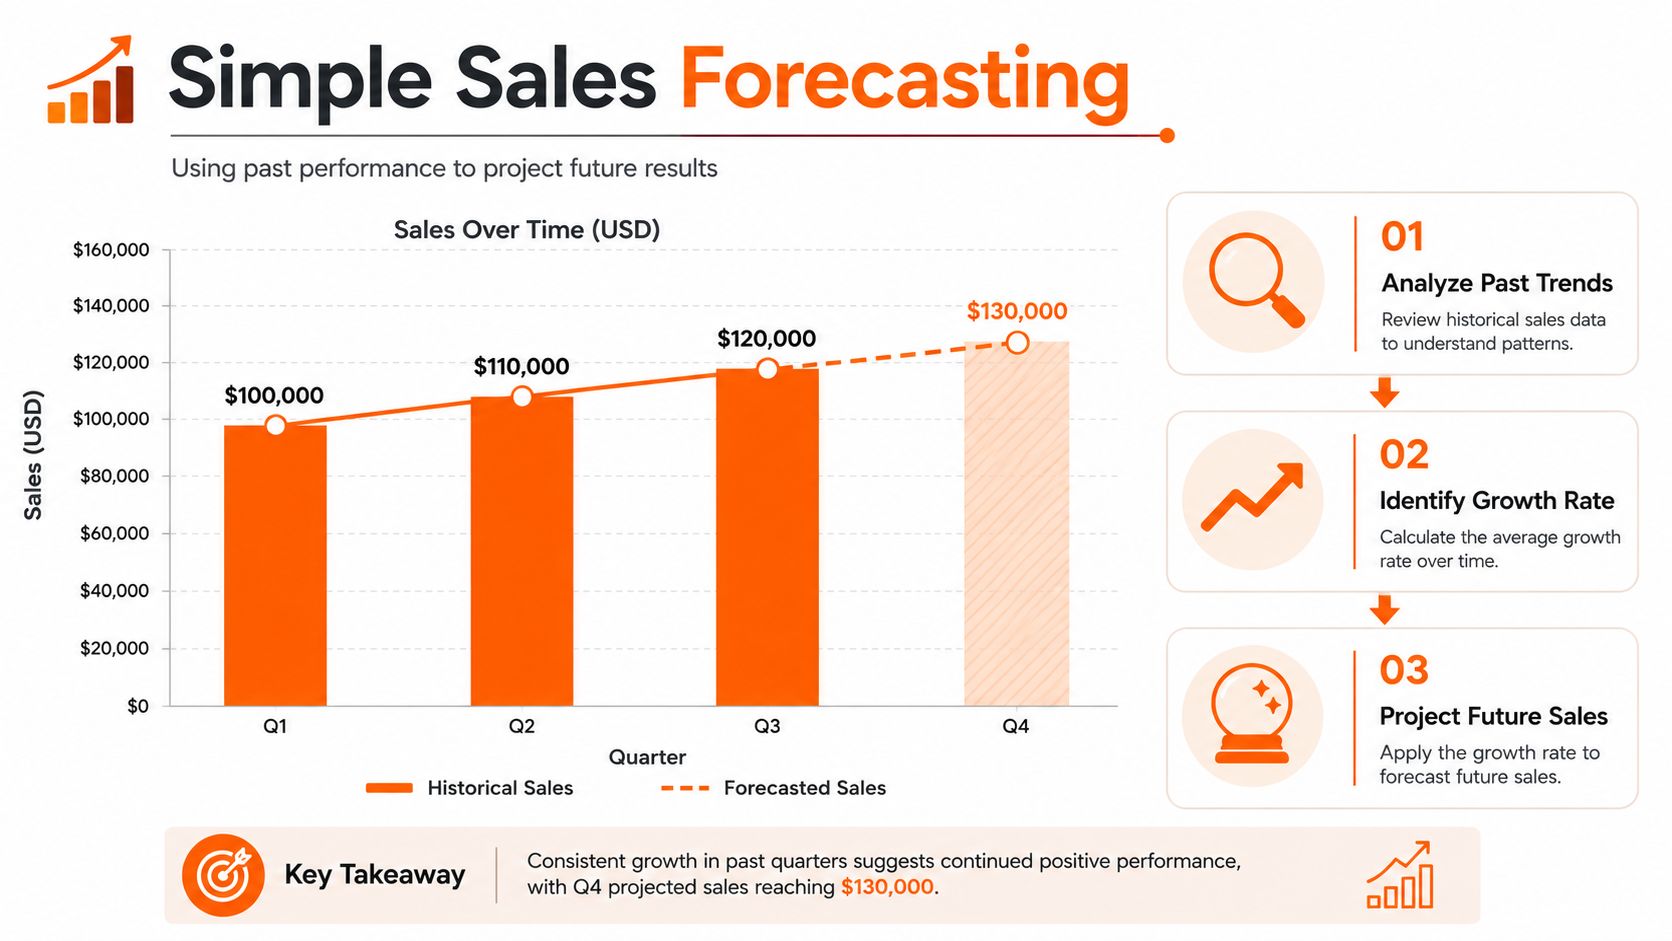
Use the simple trendline method
Open Excel or Google Sheets. Create a monthly table with:
- Month
- Leads created
- Won deals
- Revenue closed
- Average sales cycle
Then chart your closed revenue by month. Add a trendline. That gives you a rough direction.
Now check the trendline against reality:
- Is your win rate stable
- Is deal size stable
- Is your sales cycle getting longer or shorter
If those inputs look roughly consistent, the forecast is useful enough for planning.
Build the founder version of a forecast
I like this simple method better than fancy forecasting when a company is young.
- Start with recent lead volume
- Apply your observed lead-to-close pattern
- Multiply expected wins by average deal size
- Shift revenue timing based on your average sales cycle
That gives you a practical month-by-month expectation. Not a prophecy. A working estimate.
If your average sales cycle is longer than a month, don't count this month's leads as this month's revenue. That mistake makes founders feel rich on paper and broke in the bank account.
Use forecasts for planning, not ego
Forecasts are useful when they answer questions like:
- Can I afford to hire
- Do I need more pipeline now
- Will cash be tight in a future month
- Is my current target realistic
For broader planning, tie your sales forecast to your costs, runway, and goals. A resource on financial planning for startups helps connect expected revenue to real operating decisions.
Your forecast should help you place bets. It should not help you tell yourself bedtime stories.
If the sheet says revenue should rise, great. Ask why. If the answer is “because I hope so,” delete the forecast and rebuild it from actual inputs.
How to Turn Your Sales Data into Decisions
At this stage, the work pays off.
Most founders stop too early. They clean the data, calculate the metrics, nod thoughtfully, and then do nothing different on Monday. That's not analysis. That's numerically flavored procrastination.
The whole point is action. And when teams use data-driven approaches, they report productivity gains of 25 to 50 percent, revenue growth of 10 to 20 percent, and sales cycle reductions of 15 to 30 percent in these sales automation statistics. The pattern is obvious. Better decisions compound.
Use an if this then that rule
I like a simple decision frame.
If the data says this, then I do that.
A few examples:
- If win rate is low for one lead source, then cut spend there or change the message
- If referrals close faster than paid leads, then build a referral ask into onboarding
- If one product has a long sales cycle, then simplify the offer or add stronger proof
- If average deal size drops, then review discounting and packaging
- If pipeline coverage looks thin, then spend less time polishing decks and more time creating conversations
This works because it turns a metric into a move.
A decision worksheet I'd actually use
Ask these questions after every review:
| What the data says | What it might mean | What I'll test next |
|---|---|---|
| Win rate dropped | Targeting or pitch is off | Rewrite outreach or narrow ICP |
| Sales cycle got longer | Buyers are confused or stuck | Add proof, FAQs, or better follow-up |
| Deal size increased | Better-fit customers are entering | Double down on that channel |
| Conversion is weak at one stage | Handoff or message is broken | Fix that stage before buying more traffic |
That last column matters most. No metric deserves airtime unless it earns a test.
Connect sales data to retention too
Founders often treat sales and retention like separate planets. They aren't. If one segment closes easily but churns fast, your sales data is only telling half the story. That's why I like practical resources on Receiver customer retention tips when I'm pressure-testing whether “good customers” are good after the sale.
The best sales analysis doesn't end at the close. It follows the customer long enough to tell you whether you sold the right thing to the right person.
Keep the rhythm simple
Don't build a ritual you won't maintain.
I'd do this:
- Weekly: check pipeline movement and stalled deals
- Monthly: review core metrics and one main question
- Quarterly: make bigger calls on channels, pricing, and offers
That cadence is enough for most early-stage founders. Tight loop. Real action. No theater.
If you're building in Chicago or the Midwest and want honest founder conversations instead of fake networking, check out Chicago Brandstarters. It's a free, vetted community for kind, bold builders from idea stage to seven figures, with private dinner groups kept to 6 to 8 people for real conversation and real help.
Leave a Reply